

US Arizona Primaries/Caucuses Election Result 2016 Live, Arizona Candidates list, Arizona Opinion Poll 2016, US Presidential Arizona election Results, Arizona Past election Results, Arizona Election Updates Exit Poll, Arizona Schedule/Dates, Who will win in Arizona Primary/Caucus, USA Presidential election, Arizona Republican Democratic Vote Swing, Arizona Republican Candidate
Presidential Elections 2020, US Election Result November 17, 2015,US Arizona Election Result 2016 Live By County Republican Democrats , Arizona Candidates list, Arizona Opinion Poll 2016, US Presidential Arizona election Results, Arizona Past election Results, Arizona Election Updates Exit Poll, Arizona Schedule/Dates, Who will win in Arizona Primary/Caucus, USA Presidential election, Arizona Republican Democratic Vote Swing, Arizona Republican Candidate
Arizona election result analysis with vote percentage and margin is shown with vote swing achieved by Democratic and Republican Candidate. Latest Election Updates, Opinion/Exit Poll, Candidate list, Election Result 2016, Schedule.
US Arizona Election Result 2016 Live By County
|
2016 Arizona Presidential Election Results |
||
|
89.8% Reporting Electoral Votes: 11 |
||
|
Polls Closing: 9:00 PM ET |
||
|
R D. Trump |
49.70% |
9,08,035 |
|
D H. Clinton |
45.30% |
8,27,025 |
|
L G. Johnson |
3.80% |
69,046 |
|
G J. Stein |
1.20% |
21,410 |
|
2016 Arizona Presidential Election Results by County |
||
|
Apache County |
||
|
38.6% Reporting |
||
|
R D. Trump |
48.10% |
4,352 |
|
D H. Clinton |
46.40% |
4,193 |
|
L G. Johnson |
3.90% |
352 |
|
G J. Stein |
1.60% |
145 |
|
Cochise County |
||
|
100% Reporting |
||
|
R D. Trump |
59.10% |
22,089 |
|
D H. Clinton |
34.80% |
12,999 |
|
L G. Johnson |
4.50% |
1,697 |
|
G J. Stein |
1.70% |
621 |
|
Coconino County |
||
|
98.6% Reporting |
||
|
D H. Clinton |
56.30% |
25,308 |
|
R D. Trump |
36.90% |
16,573 |
|
L G. Johnson |
4.70% |
2,117 |
|
G J. Stein |
2.10% |
931 |
|
Gila County |
||
|
100% Reporting |
||
|
R D. Trump |
63.30% |
12,342 |
|
D H. Clinton |
32.30% |
6,295 |
|
L G. Johnson |
3.60% |
693 |
|
G J. Stein |
0.90% |
181 |
|
Graham County |
||
|
100% Reporting |
||
|
R D. Trump |
66.20% |
7,348 |
|
D H. Clinton |
28.80% |
3,194 |
|
L G. Johnson |
4.10% |
455 |
|
G J. Stein |
1.00% |
109 |
|
Greenlee County |
||
|
100% Reporting |
||
|
R D. Trump |
58.30% |
1,892 |
|
D H. Clinton |
33.70% |
1,092 |
|
L G. Johnson |
6.20% |
200 |
|
G J. Stein |
1.80% |
59 |
|
La Paz County |
||
|
100% Reporting |
||
|
R D. Trump |
68.60% |
3,381 |
|
D H. Clinton |
26.70% |
1,318 |
|
L G. Johnson |
3.60% |
177 |
|
G J. Stein |
1.10% |
55 |
|
Maricopa County |
||
|
96.4% Reporting |
||
|
R D. Trump |
49.30% |
5,40,943 |
|
D H. Clinton |
45.60% |
5,00,424 |
|
L G. Johnson |
4.00% |
43,421 |
|
G J. Stein |
1.10% |
12,140 |
|
Mohave County |
||
|
91.7% Reporting |
||
|
R D. Trump |
73.60% |
47,675 |
|
D H. Clinton |
22.40% |
14,517 |
|
L G. Johnson |
3.10% |
2,033 |
|
G J. Stein |
0.90% |
573 |
|
Navajo County |
||
|
92.9% Reporting |
||
|
R D. Trump |
56.30% |
14,102 |
|
D H. Clinton |
38.70% |
9,695 |
|
L G. Johnson |
3.50% |
875 |
|
G J. Stein |
1.50% |
380 |
|
Pima County |
||
|
63.3% Reporting |
||
|
D H. Clinton |
55.20% |
1,67,270 |
|
R D. Trump |
40.00% |
1,21,236 |
|
L G. Johnson |
3.40% |
10,402 |
|
G J. Stein |
1.30% |
4,013 |
|
Pinal County |
||
|
99% Reporting |
||
|
R D. Trump |
57.40% |
44,432 |
|
D H. Clinton |
38.20% |
29,546 |
|
L G. Johnson |
3.40% |
2,602 |
|
G J. Stein |
1.00% |
807 |
|
Santa Cruz County |
||
|
100% Reporting |
||
|
D H. Clinton |
72.50% |
7,769 |
|
R D. Trump |
23.80% |
2,556 |
|
L G. Johnson |
2.50% |
268 |
|
G J. Stein |
1.20% |
129 |
|
Yavapai County |
||
|
97.8% Reporting |
||
|
R D. Trump |
63.20% |
48,528 |
|
D H. Clinton |
32.70% |
25,069 |
|
L G. Johnson |
3.10% |
2,355 |
|
G J. Stein |
1.10% |
829 |
|
Yuma County |
||
|
100% Reporting |
||
|
R D. Trump |
50.50% |
20,586 |
|
D H. Clinton |
45.00% |
18,336 |
|
L G. Johnson |
3.40% |
1,399 |
|
G J. Stein |
1.10% |
438 |
Arizona Primary Results are as follows for Republicans and Democrats.
Democratic Primary Results 2016
| Arizona Democratic Primary, 2016 | |||
|---|---|---|---|
| Candidate | Vote % | Votes | Delegates |
| Hillary Clinton | 57.6% | 235,697 | 42 |
| Bernie Sanders | 39.9% | 163,400 | 33 |
Republican Primary Results 2016
| Arizona Republican Primary, 2016 | |||
|---|---|---|---|
| Candidate | Vote % | Votes | Delegates |
| Donald Trump | 47.1% | 248,383 | 58 |
| Ted Cruz | 24.8% | 130,762 | 0 |
Past Presidential Election Results Party Wise.
|
Arizona |
||||||||
|
1980 |
1984 |
1988 |
1992 |
1996 |
2000 |
2004 |
2008 |
2012 |
|
R |
R |
R |
R |
D |
R |
R |
R |
R |
*D–Democratic
*R–Republican
ALSO READ: Arizona Presidential Election Result By County by state by district by party—Find Latest Arizona Presidential Election Result By County by state by district by party list of counties Population area code Result History Seat Density FIPS Code Voter statistics
Click below on each county to know 2012 2008 US presidential election results, votes , margin, swing ,Winner runner up
| County | State |
| La Paz | Arizona |
| Maricopa | Arizona |
| Mohave | Arizona |
| Navajo | Arizona |
| Pima | Arizona |
| Pinal | Arizona |
| Santa Cruz | Arizona |
| Yavapai | Arizona |
| Yuma | Arizona |
| Apache | Arizona |
| Cochise | Arizona |
| Coconino | Arizona |
| Gila | Arizona |
| Graham | Arizona |
| Greenlee | Arizona |
| OTHER IMP LINKS:- |
| US County Result |
| US Election Result |
| Clinton Schedule |
| Trump Schedule |
| US County List |
| US Election Dates |
| State Opinion Poll |
| Nation Opinion Poll |
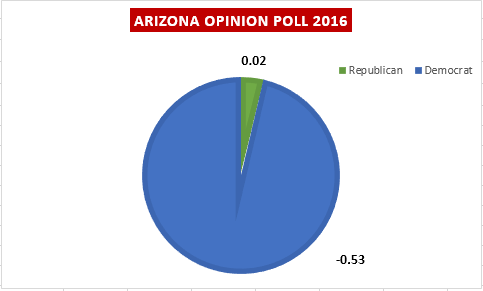
Following is an analysis of Past Election Results. We have taken out a swing by subtracting vote % received in 2008 from that received in 2012 for each party. This shows the positive and negative swing for a particular Party in that state.
|
State
|
Party
|
Swing/Margin
(2012-2008) |
Result
|
|
Arizona
|
Republican
|
0.02
|
Increased
|
|
Arizona
|
Democrat
|
-0.53
|
Decreased
|
|
Year
|
State
|
Name
|
Party
|
Total Vote
|
General %
|
Status
|
|
|
2008
|
Arizona
|
McCain, John
|
Republican
|
1,230,111
|
53.64%
|
Winner
|
|
|
2008
|
Arizona
|
Obama, Barack
|
Democrat
|
1,034,707
|
45.12%
|
Runner Up
|
|
|
2008
|
Arizona
|
Barr, Bob
|
LBT
|
12,555
|
0.55%
|
||
|
2008
|
Arizona
|
Nader, Ralph
|
I
|
11,301
|
0.49%
|
||
|
2008
|
Arizona
|
McKinney, Cynthia
|
GRE
|
3,406
|
0.15%
|
||
|
2008
|
Arizona
|
Baldwin, Chuck
|
W
|
1,371
|
0.06%
|
||
|
2008
|
Arizona
|
Jay, Charles
|
W
|
16
|
0.00%
|
||
|
2008
|
Arizona
|
Allen, Jonathan
|
W
|
8
|
0.00%
|
||
|
Year
|
State
|
Name
|
Party
|
Total Vote
|
General %
|
Status
|
Swing
|
|
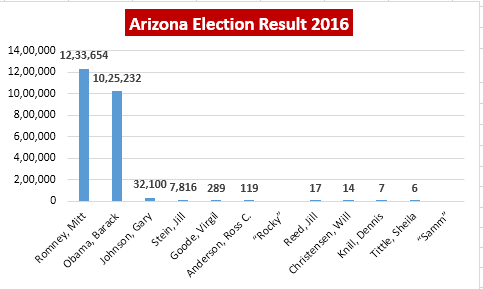
2012
|
Arizona
|
Romney, Mitt
|
Republican
|
1,233,654
|
53.65%
|
Winner
|
0.02
|
|
2012
|
Arizona
|
Obama, Barack
|
Democrat
|
1,025,232
|
44.59%
|
Runner Up
|
-0.5255
|
|
2012
|
Arizona
|
Johnson, Gary
|
LIB
|
32,100
|
1.40%
|
||
|
2012
|
Arizona
|
Stein, Jill
|
GRE
|
7,816
|
0.34%
|
||
|
2012
|
Arizona
|
Goode, Virgil
|
W
|
289
|
0.01%
|
||
|
2012
|
Arizona
|
Anderson, Ross C.
"Rocky" |
W
|
119
|
0.01%
|
||
|
2012
|
Arizona
|
Reed, Jill
|
W
|
17
|
0.00%
|
||
|
2012
|
Arizona
|
Christensen, Will
|
W
|
14
|
0.00%
|
||
|
2012
|
Arizona
|
Knill, Dennis
|
W
|
7
|
0.00%
|
||
|
2012
|
Arizona
|
Tittle, Sheila
"Samm" |
W
|
6
|
0.00%
|
Click on Individual County to get more details about Arizona's counties Presidential Election Result by Party, Population History, Voter statistics
| County | FIPS County Code | County seat | Est. | Formed from | Population | Area |
| Yuma County | 27 | Yuma | 1864 | — | 1,90,557 | 5,519 sq mi |
| Yavapai County | 25 | Prescott | 1864 | — | 2,12,635 | 8,128 sq mi |
| Santa Cruz County | 23 | Nogales | 1899 | Cochise and Pima counties | 42,845 | 1,238 sq mi |
| Pinal County | 21 | Florence | 1875 | Maricopa and Pima counties | 3,24,962 | 5,374 sq mi |
| Pima County | 19 | Tucson | 1864 | — | 10,03,235 | 9,189 sq mi |
| Navajo County | 17 | Holbrook | 1895 | Apache County | 1,11,273 | 9,959 sq mi |
| Mohave County | 15 | Kingman | 1864 | — | 1,94,944 | 13,470 sq mi |
| Maricopa County | 13 | Phoenix | 1871 | Pima and Yavapai Counties | 39,90,181 | 9,224 sq mi |
| La Paz County | 12 | Parker | 1983 | Yuma County | 20,172 | 4,513 sq mi |
| Greenlee County | 11 | Clifton | 1909 | Graham County | 7,754 | 1,848 sq mi |
| Graham County | 9 | Safford | 1881 | Apache and Pima Counties | 34,769 | 4,641 sq mi |
| Gila County | 7 | Globe | 1881 | Maricopa and Pinal Counties | 51,994 | 4,796 sq mi |
| Coconino County | 5 | Flagstaff | 1891 | Yavapai County | 1,34,421 | 18,661 sq mi |
| Cochise County | 3 | Bisbee | 1881 | Pima County | 1,27,866 | 6,219 sq mi |
| Apache County | 1 | St. Johns | 1879 | Yavapai County | 69,980 | 11,218 sq mi |