US Connecticut Election Result 2016 Live By County Republican Democrats, Connecticut Candidates list, Connecticut Opinion Poll 2016, US Presidential Connecticut election Results, Connecticut Past election Results, Connecticut Election Updates Exit Poll, Connecticut Schedule/Dates, Who will win in Connecticut Primary/Caucus, USA Presidential election, Connecticut Republican Democratic Vote Swing, Connecticut Republican Candidate
Presidential Elections 2020, US Election Result November 17, 2015,US Connecticut Election Result 2016 Live By County Republican Democrats, Connecticut Candidates list, Connecticut Opinion Poll 2016, US Presidential Connecticut election Results, Connecticut Past election Results, Connecticut Election Updates Exit Poll, Connecticut Schedule/Dates, Who will win in Connecticut Primary/Caucus, USA Presidential election, Connecticut Republican Democratic Vote Swing, Connecticut Republican Candidate
Connecticut election result analysis with vote percentage and margin is shown with vote swing achieved by Democratic and Republican Candidate. Latest Election Updates, Opinion/Exit Poll, Candidate list, Election Result 2016, Schedule.
US Connecticut Election Result 2016 Live By County
|
2016 Connecticut Presidential Election Results |
|||
|
95.9% Reporting Electoral Votes: 7 |
|||
|
Polls Closing: 8:00 PM ET |
Electoral Votes |
||
|
D Winner H. Clinton |
54.00% |
8,14,482 |
7 |
|
R D. Trump |
41.60% |
6,28,320 |
|
|
2016 Connecticut Presidential Election Results by County |
|||
|
Fairfield County |
|||
|
82.7% Reporting |
|||
|
D H. Clinton |
56.50% |
1,84,261 |
|
|
R D. Trump |
39.40% |
1,28,534 |
|
|
Hartford County |
|||
|
98.8% Reporting |
|||
|
D H. Clinton |
59.10% |
2,21,164 |
|
|
R D. Trump |
36.60% |
1,36,758 |
|
|
Litchfield County |
|||
|
100% Reporting |
|||
|
R D. Trump |
54.90% |
53,425 |
|
|
D H. Clinton |
40.80% |
39,716 |
|
|
Middlesex County |
|||
|
100% Reporting |
|||
|
D H. Clinton |
51.10% |
44,557 |
|
|
R D. Trump |
44.10% |
38,415 |
|
|
New Haven County |
|||
|
99.5% Reporting |
|||
|
D H. Clinton |
54.20% |
2,01,349 |
|
|
R D. Trump |
42.20% |
1,56,731 |
|
|
New London County |
|||
|
100% Reporting |
|||
|
D H. Clinton |
50.50% |
62,901 |
|
|
R D. Trump |
43.90% |
54,742 |
|
|
Tolland County |
|||
|
100% Reporting |
|||
|
D H. Clinton |
50.10% |
38,767 |
|
|
R D. Trump |
43.90% |
33,983 |
|
|
Windham County |
|||
|
100% Reporting |
|||
|
R D. Trump |
50.80% |
25,732 |
|
|
D H. Clinton |
42.90% |
21,767 |
|
Connecticut Primary Results are as follows for Republicans and Democrats.
Democratic Primary Results 2016
| Connecticut Democratic Primary, 2016 | |||
|---|---|---|---|
| Candidate | Vote % | Votes | Delegates |
| Hillary Clinton | 51.6% | 170,150 | 27 |
| Bernie Sanders | 46.6% | 153,489 | 26 |
Republican Primary Results 2016
| Connecticut Republican Primary, 2016 | |||
|---|---|---|---|
| Candidate | Vote % | Votes | Delegates |
| Donald Trump | 57.7% | 123,239 | 28 |
| John Kasich | 28.5% | 60,769 | 0 |
Past Presidential Election Results Party Wise.
|
Connecticut |
|||||||||
|
1980 |
1984 |
1988 |
1992 |
1996 |
2000 |
2004 |
2008 |
2012 |
|
|
R |
R |
R |
D |
D |
D |
D |
D |
D |
|
*D–Democratic
*R–Republican
ALSO READ: Connecticut Presidential Election Result By County by state by district by party—Find Latest Connecticut Presidential Election Result By County by state by district by party list of counties Population area code Result History Seat Density FIPS Code Voter statistics
| OTHER IMP LINKS:- |
| US County Result |
| US Election Result |
| Clinton Schedule |
| Trump Schedule |
| US County List |
| US Election Dates |
| State Opinion Poll |
| Nation Opinion Poll |
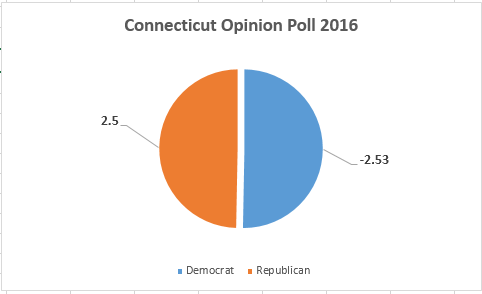
Following is an analysis of Past Election Results. We have taken out a swing by subtracting vote % received in 2008 from that received in 2012 for each party. This shows the positive and negative swing for a particular Party in that state.
|
State
|
Party
|
Swing/Margin
(2012-2008) |
Result
|
|
Connecticut
|
Democrat
|
-2.53
|
Decreased
|
|
Connecticut
|
Republican
|
2.5
|
Increased
|
|
Year
|
State
|
Name
|
Party
|
Total Vote
|
General %
|
Status
|
|
|
2008
|
Connecticut
|
Obama, Barack
|
Democrat
|
997,772
|
60.59%
|
Winner
|
|
|
2008
|
Connecticut
|
McCain, John
|
Republican
|
629,428
|
38.22%
|
Runner Up
|
|
|
2008
|
Connecticut
|
Nader, Ralph
|
I
|
19,162
|
1.16%
|
||
|
2008
|
Connecticut
|
Baldwin, Chuck
|
W
|
311
|
0.02%
|
||
|
2008
|
Connecticut
|
McKinney, Cynthia
|
W
|
90
|
0.01%
|
||
|
2008
|
Connecticut
|
Moore, Brian
|
W
|
19
|
0.00%
|
||
|
2008
|
Connecticut
|
Calero, Roger
|
W
|
15
|
0.00%
|
||
|
Year
|
State
|
Name
|
Party
|
Total Vote
|
General %
|
Status
|
Swing
|
|
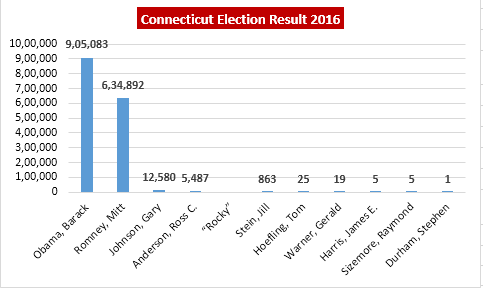
2012
|
Connecticut
|
Obama, Barack
|
Democrat
|
905,083
|
58.06%
|
Winner
|
-2.5318
|
|
2012
|
Connecticut
|
Romney, Mitt
|
Republican
|
634,892
|
40.73%
|
Runner Up
|
2.5
|
|
2012
|
Connecticut
|
Johnson, Gary
|
LIB
|
12,580
|
0.81%
|
||
|
2012
|
Connecticut
|
Anderson, Ross C.
"Rocky" |
IP
|
5,487
|
0.35%
|
||
|
2012
|
Connecticut
|
Stein, Jill
|
W
|
863
|
0.06%
|
||
|
2012
|
Connecticut
|
Hoefling, Tom
|
W
|
25
|
0.00%
|
||
|
2012
|
Connecticut
|
Warner, Gerald
|
W
|
19
|
0.00%
|
||
|
2012
|
Connecticut
|
Harris, James E.
|
W
|
5
|
0.00%
|
||
|
2012
|
Connecticut
|
Sizemore, Raymond
|
W
|
5
|
0.00%
|
||
|
2012
|
Connecticut
|
Durham, Stephen
|
W
|
1
|
0.00%
|